
 Multi Function Displays
 Radars
 Fish Finders & Transducers
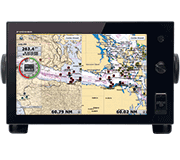 GPS & Chart Plotters
 Autopilots
 Navigation
 Sonars
 Commercial


GPS and Chart Plotters
Chart Plotters have come a long way since Furuno developed the world’s first Video Plotter in 1979. No electronic charts were available at that time, and location and Track were displayed on a simple vector grid. Today’s helm is a technological marvel compared to the helms of the past. Only your Chart Plotter, though, can show you cartographically where you are, where you’ve been, and where you’re headed.
Navigate with confidence, let Furuno chart your course!
From sail boats and center consoles to workboats and cruise ships, Furuno has GPS Chart Plotters for every need and every situation.
-
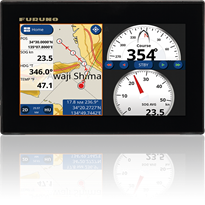
GP1871F
7" Multi Touch GPS/WAAS Chart Plotter with CHIRP and Conventional Fish FinderDetails -
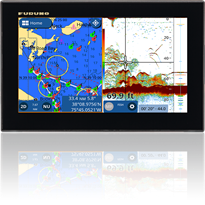
GP1971F
9" Multi Touch GPS/WAAS Chart Plotter with CHIRP and Conventional Fish FinderDetails -
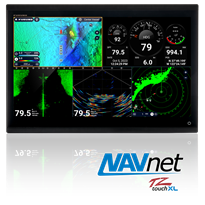
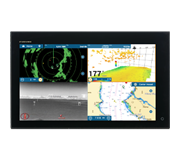
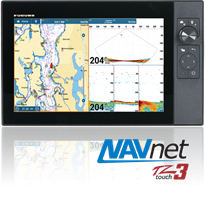
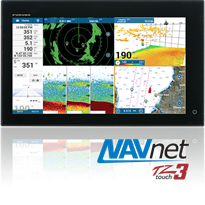
TZT22X
NavNet TZtouchXL Chart Plotter, 22" All-Glass IPS Display FULL HD (1920x1080)Details -
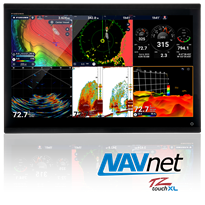
TZT24X
NavNet TZtouchXL Chart Plotter, 24" All-Glass IPS Display FULL HD (1920x1080)Details -

TZT9F
NLA, recommend TZT12F or TZT10XDetails


A Chart Plotter serves many useful functions on your boat
Your Chart Plotter serves a number of useful functions on your boat. It allows you, the navigator, to:
- Know your current location at a glance
- Show obstructions, buoys, navigation lanes and other ATN (Aids To Navigation)
- Show Bathymetry (water depth) for a given location
- Save Waypoints for important locations so you can navigate back to them at any time
- Plan out your voyage and save your Routes
- Steer your Autopilot
- Save and view your Track
- Instantly record MOB (Man Overboard) location
- Record travel time and plot ETA to destination
- Find specific POI (Point Of Interest), such as harbors and fueling stations
- View tidal and current forecasts
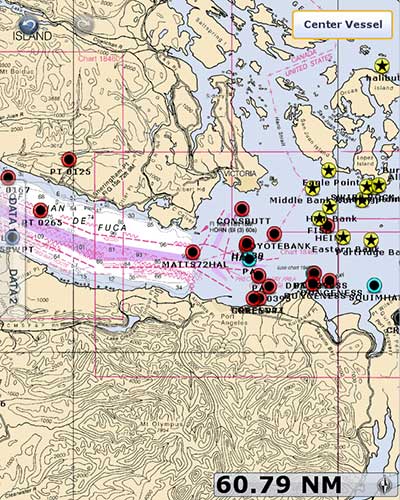
Raster Charts, your digital photographs
Raster charts are simply scanned paper charts that have been digitized for use on an electronic Chart Plotter. Think of these as digital photographs of the actual paper charts - for, this is exactly what they are! Raster charts maintain the look and feel of paper charts you may already be familiar with, and many boaters have decided that these are the charts they prefer simply because of this familiarity.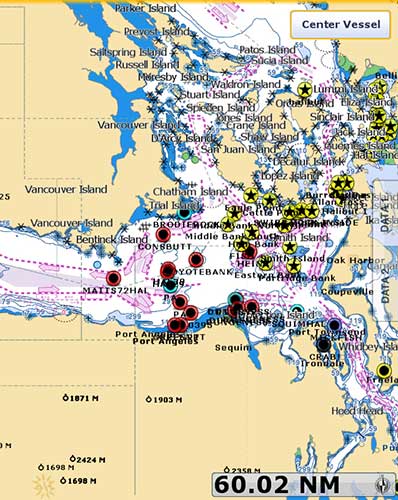
Vector Charts, the digital cousin of Raster Charts
Vector charts are a digital representation of the information found on paper charts. Think of Vector charts as a database of information that your Chart Plotter’s software uses to draw the chart on the screen. Coastlines, shipping lanes, buoys, wrecks and other obstructions, even spot soundings - all of this information is stored in the machine not as an image or map, but only as mathematical data that your Chart Plotter can access to draw a picture of your chart. Vector charts typically contain more data than a Raster chart, and this data is organized in individual ‘layers’ which can be turned on or off, allowing you to display as much or as little information as you desire.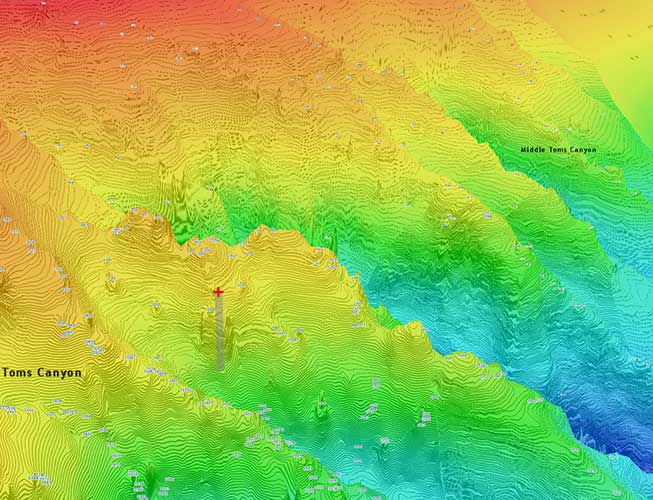
Paint the sea floor contours with Bathymetric Fishing Charts
Bathymetric, or ‘Fishing’ Charts, depict the contour of the sea floor. These charts are designed to present an accurate, measurable description and visual presentation of the submerged terrain. These charts provide the commercial and recreational fisherman with a powerful tool to enhance your catch.
Bathymetric charts differ from navigation charts in that the presentation of underwater features is their primary purpose. Safe navigation is the primary purpose of a navigation chart.
Navigate with color for at-a-glance awareness
Nearly all Furuno Chart Plotters can show depth shading - that is, color shades overlaid on the chart that reflect the depth of the charted area. Using Depth Shading, you can easily tell where the shallows end and the deeper, safer-to-navigate waters begin. Depth Shading can be customized so that preset depths are shaded in colors of your choice.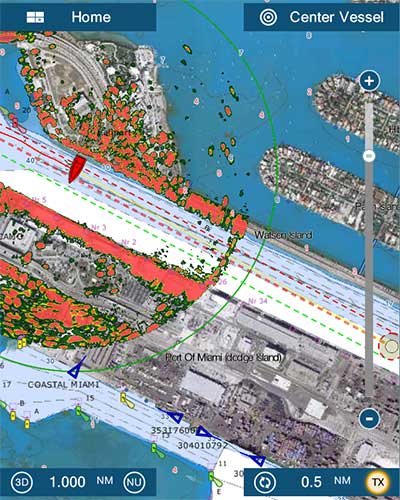
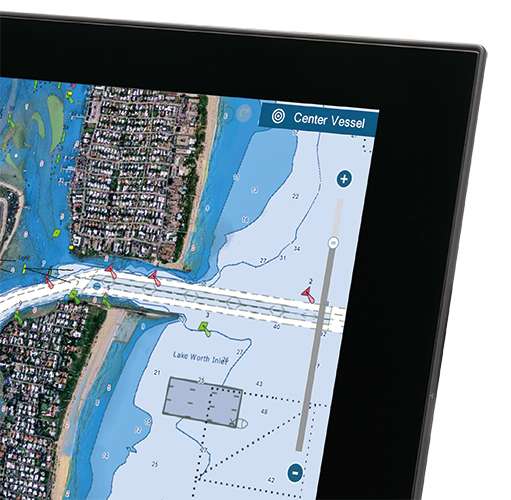
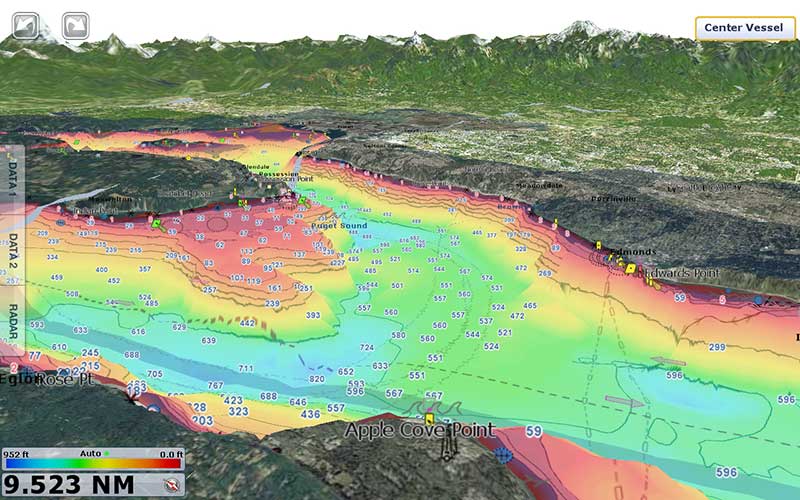
Layered information brings more useful data to your charts
When it comes to information overlay, look no further than Furuno’s NavNet MFDs. The TimeZero engine that drives these systems allows for an unprecedented level of customization when it comes to expanding the display presentation. Of course, Depth Shading and Satellite Photo Overlay are standard fare these days. TimeZero, though, presents this information in an entirely new way that we call Satellite Photo Fusion. Satellite Photo Fusion allows you to overlay the Satellite photography onto your chart, but the photo will only shows in areas where there is a charted depth of zero - that is, land masses. From there, the photo becomes less opaque as the water depth increases, allowing you to see the chart information where you need it without being obscured by the photo image. The result is the smooth, attractive transition from sat photo to chart.
You can also overlay your Radar targets onto the chart to make it even easier to understand what you are looking at around your boat. Simply add a heading sensor and you will be able to easily line up and overlay the Radar targets, and they will automatically scale up or down as you zoom in and out of your chart.